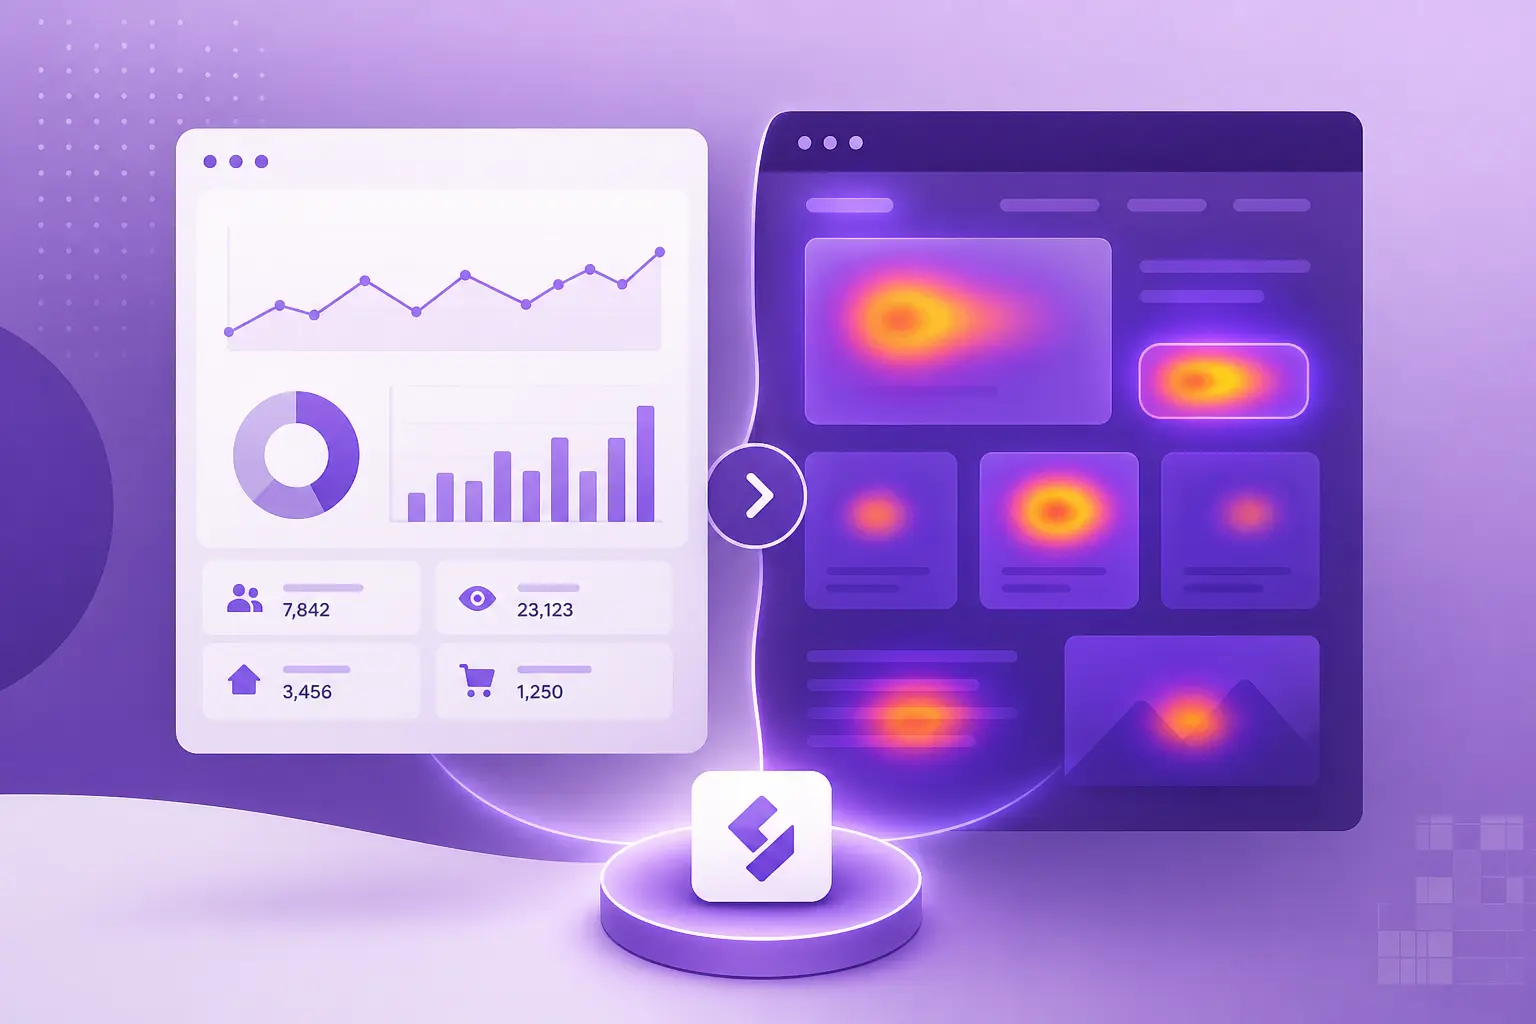
Most businesses use tools like Google Analytics to track website traffic, page views, bounce rates, and conversions. While these numbers are useful, they often fail to explain why visitors behave the way they do.
You may know that users leave a page quickly—but do you know where they got confused, what they ignored, or what stopped them from converting?
That’s where heatmap data becomes powerful.
At SquareZix, we help businesses go beyond numbers by using heatmaps and behavioral insights to improve website performance, user experience, and lead generation.
Discover Our Expertise
Explore our company profile to learn more about our Digital Transformation Services, and how we can help your business thrive in the digital world.
What Is Heatmap Data?
A heatmap is a visual representation of how visitors interact with your website.
It shows:
- Where users click
- How far they scroll
- Which sections attract attention
- What elements users ignore
- Where users hesitate or rage-click
Instead of raw numbers, heatmaps reveal actual user behavior visually.
The Problem With Traditional Analytics Alone
Traditional analytics tools can tell you:
- How many people visited
- Which page they landed on
- How long they stayed
- Bounce rate
- Conversion rate
But they often cannot clearly show:
- Why users didn’t click your CTA
- Why visitors abandoned the form
- Why nobody scrolls below the first section
- Why mobile users leave faster
- Why an important offer is being missed
This creates guesswork.
Why Heatmap Data Reveals More
1. You See Where Users Actually Click
Many businesses assume users click the obvious button.
Heatmaps often reveal users clicking:
- Images
- Non-clickable text
- Logos
- Wrong buttons
This helps identify confusion and missed opportunities.
2. You Learn How Far Visitors Scroll
If users never reach your pricing section, testimonials, or contact form, conversions may suffer.
Scroll heatmaps show exactly where attention drops.
3. You Identify Ignored Content
Sometimes businesses spend time creating sections no one reads.
Heatmaps reveal which content gets attention and which sections are invisible to users.
4. You Improve Call-to-Action Placement
If your CTA button gets ignored, it may be:
- Too low on page
- Poorly designed
- Hidden among clutter
- Not clear enough
Heatmaps help optimize placement and visibility.
5. You Understand Mobile Behavior Better
Desktop and mobile visitors behave differently.
Heatmaps can reveal:
- Frustrating tap areas
- Poor spacing
- Hidden buttons
- Difficult scrolling layouts
This is critical because many businesses lose leads on mobile.
Real Example of the Problem
Traditional analytics may say:
- 1,000 visitors landed on page
- Bounce rate 62%
- Low form submissions
Heatmap data may reveal:
- Users stop scrolling after hero section
- CTA button blends into background
- Visitors repeatedly click a non-clickable image
- Mobile users abandon before form loads
That insight creates real solutions.
How SquareZix Helps
At SquareZix, we use behavioral data—not assumptions—to improve websites.
We help businesses by:
- Installing heatmap tracking tools
- Analyzing click and scroll behavior
- Identifying user friction points
- Redesigning website pages for better conversions
- Improving mobile user experience
- Optimizing CTA placement and layouts
- Turning website traffic into measurable leads
We don’t just track traffic—we improve what traffic does.
Final Thoughts
Traditional analytics tell you what happened.
Heatmaps help explain why it happened.
When combined together, they become one of the most powerful tools for improving website conversions and user experience.
If your website gets traffic but poor results, heatmap insights could reveal the hidden problems numbers alone miss.
Frequently Asked Questions (FAQs)
1. What is a website heatmap?
A heatmap visually shows where users click, scroll, and interact on your website.
2. Is heatmap data better than Google Analytics?
Not better—different. Analytics shows numbers, heatmaps show behavior. Together they work best.
3. Can heatmaps increase conversions?
Yes. They help identify problems that block users from taking action.
4. Do heatmaps slow down websites?
Most modern heatmap tools have minimal impact when installed correctly.
5. Are heatmaps useful for mobile websites?
Yes. They are especially valuable for understanding mobile user frustrations.
6. What pages should use heatmaps?
Landing pages, service pages, product pages, checkout pages, and contact pages.
7. How does SquareZix help with heatmap optimization?
SquareZix analyzes heatmap data and improves design, layout, speed, and user flow to generate better results.